The Need Is Growing!
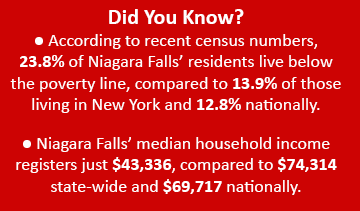 Since 1925, Community Missions has served the Niagara community. While needs have always been present, the past decade has seen a tremendous increase in demand for the Mission's services. Today, nearly one quarter (23.8%) of residents in the city of Niagara Falls live below the poverty line, including 37% of children within the city.
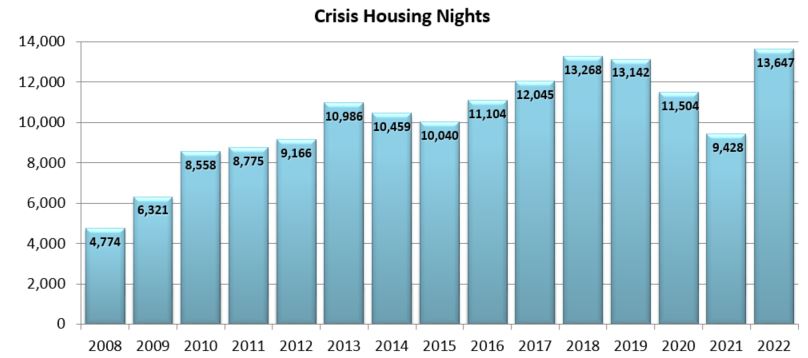
View the charts below to see how demand has increased at the Mission over recent years, and click on this link to download a PDF chart of our Crisis & Community Services Total Statistics from 2004-2022.
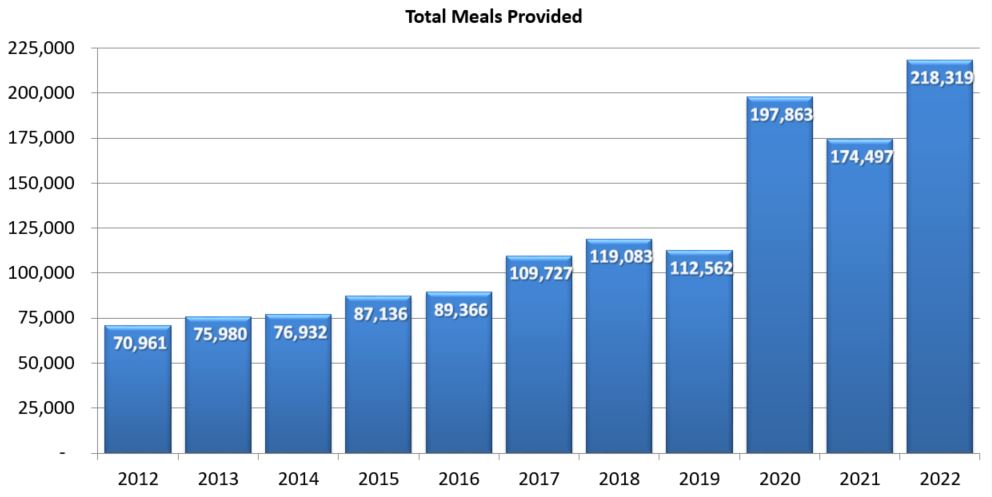
The chart above shows the increased demand for meals provided by the Mission over the past 11 years. The Mission has seen remarkable increases in meals provided, resulting in a 144% increase in just the past six years, due in large part to a substantial increase during the COVID-19 pandemic.


By The Numbers...
In 2024, Community Missions provided:
• 12,441 nights of shelter
• 144,441 meals
• 4,379 individuals with clothing
• 8,071 care days in Youth Services
• 55,083 care days in Recovery Services
• 69,290 care days in Housing Services
• 496 reflections & resources for Faith Development
 Community Missions of Niagara Frontier, Inc.