"How Are Things at the Mission?"
Whenever I am out around town, many people will ask me the same question, “How are things at the Mission?” While I typically offer something along the lines of, “things are good, just busy,” the true answer is always a much more complicated one. Let me take a few moments to dive a bit deeper.
While Community Missions offers 19 programs that work with a variety of populations, those that immediately come to mind for many of our supporters are those within our Crisis & Community Services. The Emergency Housing Shelter, Community Kitchen, Food Pantry, Parole Re-Entry, Clothes Closet and other such programs are all housed at 1570 Buffalo Ave., the main site where our supporters drop off donations and volunteer. In future weeks, we’ll be discussing many of our other programs and how they serve the community, but today we’ll focus on these Crisis & Community Services.

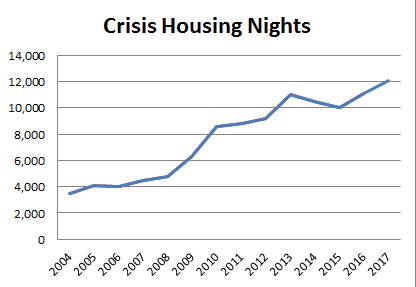
This growth has continued at about that same rate on the housing side over the past few years. The past three years have been a linear increase, moving from 10,040 nights in 2015 to 11,104 nights in 2016, and an all-time high of 12,045 nights in 2017. We will typically see some ebb and flow among particular programs, and in particular last year saw a 25% increase over 2016 in nights in the emergency housing (homeless) shelter, including a disheartening 34% jump in nights for our guests aged 12 and under.

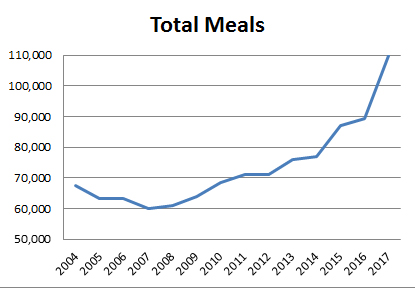
The vast increase has come within the food pantry, where the meals provided jumped from 41,823 in 2016 to 62,337 last year, an incredible 49% increase. Plans over the coming months include a survey to be administered within the pantry for the agency to get a better feel as to why such an increase has taken place. We feel that at least part of the story is, thanks to the many wonderful partnerships that we have built with local restaurants and stores (more on that in future blogs J), that we are able to offer a better and wider selection of food within the pantry, including meats and produce along with the breads and canned goods that have typically been available.
Regardless, these are busy times at Community Missions, which can be viewed multiple ways. While some may see the increased demand as a negative, speaking to how great the need is in the area, we choose to see this as a positive. If people are in need of assistance, we are glad to be able to provide that help, and to build the relationships with donors, supporters, community groups and businesses to meet these needs. So often, food can be the first step for people in need of help. Someone may come to the Kitchen or the Pantry, then learn of our mental health services, furniture giveaway, and numerous other programs that can lead to deeper connections with the Mission, so that the community as a whole can be better served.
I told you in the beginning that it was really a complicated answer. So how are things at the Mission? Busy. Wonderfully busy.
By The Numbers...
In 2024, Community Missions provided:
• 12,441 nights of shelter
• 144,441 meals
• 4,379 individuals with clothing
• 8,071 care days in Youth Services
• 55,083 care days in Recovery Services
• 69,290 care days in Housing Services
• 496 reflections & resources for Faith Development


 Community Missions of Niagara Frontier, Inc.
